 two year trip
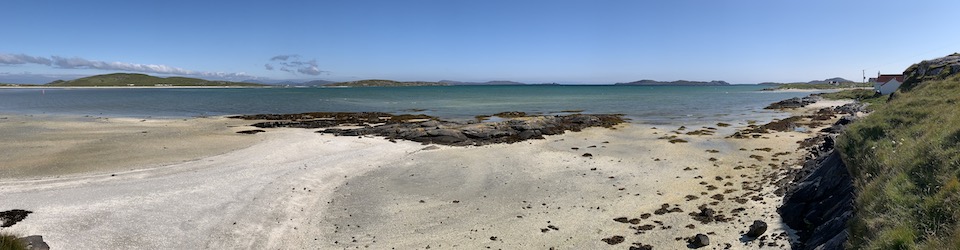
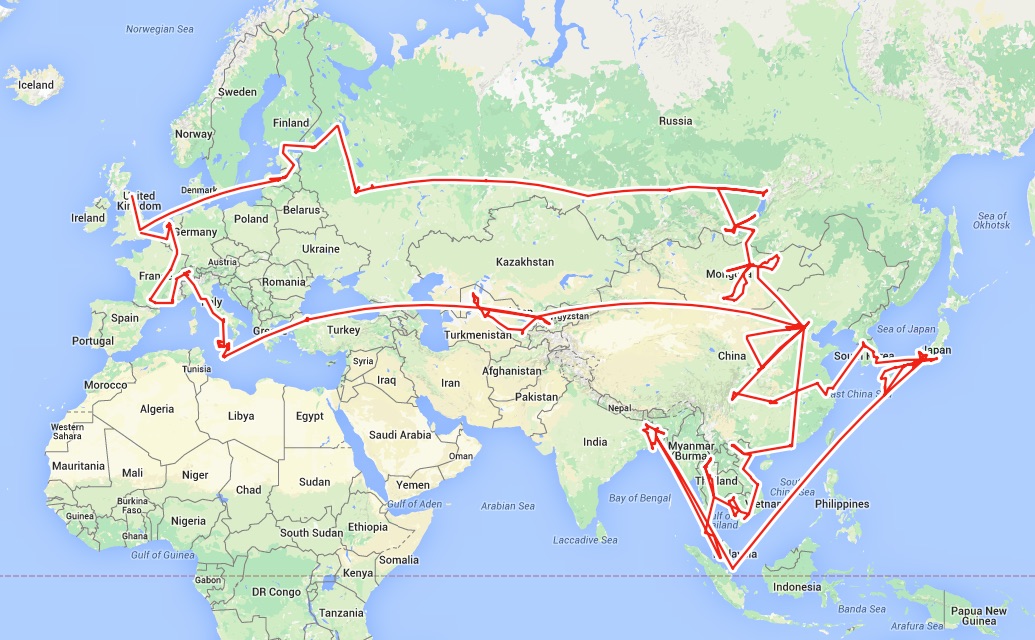
Everyone likes to know the numbers behind something (or is that just me?). Here’s the breakdown of our two year trip, starting with our route generated from the GPS tags in Andrew’s photos.
| Length of time on the road | 774 days 2 years 1 month 14 days |
| Number of countries visited | 25 |
| Distance travelled | 72,284 km 44,915 miles |
| Number of beds slept in | 199 |
| Number of blog posts written (before this one) | 253 |
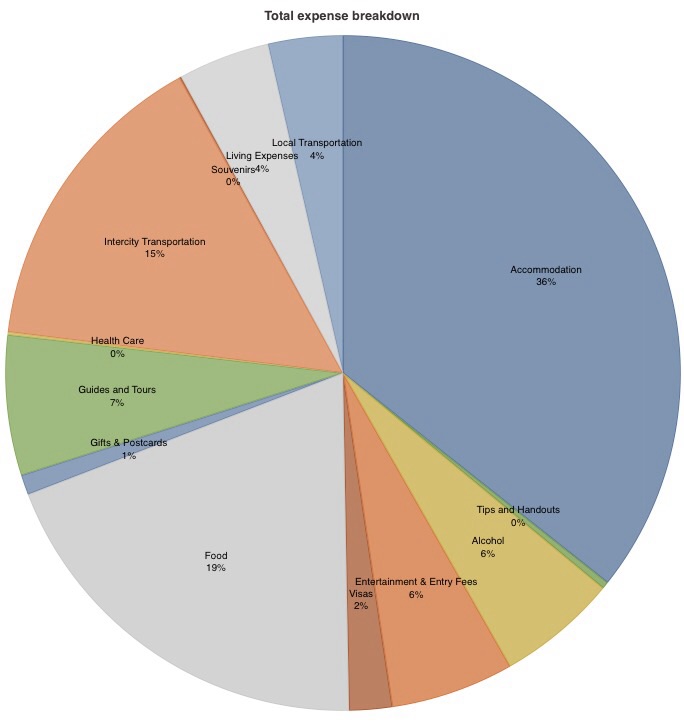
| Total spend (for two people) | £54,394.90 |
| Average daily spend (for two people) | £70.28 |
It’s a shame that our last month pushed us just over our target daily average of £70 per day. This was largely due to the cost of apartment rental in Amsterdam, we spent more on accommodation in April 2015 than any other month of the trip.
| Number of train journeys | 120 |
| Number of hours spent on trains | 591.5 hours |
| Longest single train journey (Severobaikalsk to Irkutsk) | 37.75 hours |
| Number of flights | 12 |
| Number of hours spent in the air | 37 hours |
| Pairs of replacement shoes bought | 4 |
As well as writing about our travels on this blog, we’ve taken a lot of photos to remind us of our two years of travelling, and our method for storing them worked very well.
| Number of photos taken (total) | 88,486 |
| Average photos taken per day (total) | 114 |
| Number of photos taken (Julie) | 42,485 |
| Number of photos taken (Andrew) | 46,001 |
| GB of data in photos taken (total) | 384.5 GB |
We knew that we’d be visiting some more exotic locations and vaccinations before the trip started were necessary. We’ve been fortunate that we’ve been pretty healthy while we’ve been away and on the few occasions that we’ve needed something from the pharmacy, either the pharmacist spoke English or some creative miming was sufficient to communicate what we needed!
| Visits to doctor | 0 |
| Purchases from pharmacy | 6 |
| Eye tests | 1 |
| Fleas captured | 1 |
| Ticks removed | 1 |
| Mosquito bites | Hundreds! |
We were pleasantly surprised by how ubiquitous WiFi is around the world, though obviously internet connections aren’t possible or are so slow as to be unusable in the remoter areas of developing countries such as Mongolia, Bangladesh and Uzbekistan. That said, the nicer accommodation options in their capitals and larger cities were pretty good, if a little flaky at times. We used the Ookla Speedtest app to check internet speeds in the places we stayed.
| Fastest internet connection (Tokyo, Japan) | ||
| Slowest internet connection (Nukus, Uzbekistan) |
Love the map. And the stats.
Andrew is very proud of the map! If you ask him nicely he’ll explain in detail how he made it… ;-)